
IELTS Academic Writing Task 1 asks you to describe visual information in at least 150 words. You may see a line graph, bar chart, pie chart, table, map, or process diagram. Your job is not to give personal opinions. Instead, you must summarise the key information clearly, compare important details, and use accurate academic language.
For beginners, Task 1 can feel difficult because every question looks different. However, the basic method is always the same: understand the visual, write a clear overview, organise the main details, and use suitable vocabulary.
Read More: IELTS Speaking Test: What Happens and How to Prepare
What Does IELTS Writing Task 1 Test?
Task 1 tests whether you can:
– Identify the most important information
– Group similar data
– Compare and contrast details
– Describe changes over time
– Use accurate grammar and vocabulary
– Write in a clear academic style
You should spend about 20 minutes on Task 1. Task 2 is worth more marks, so do not spend too long on the first task.
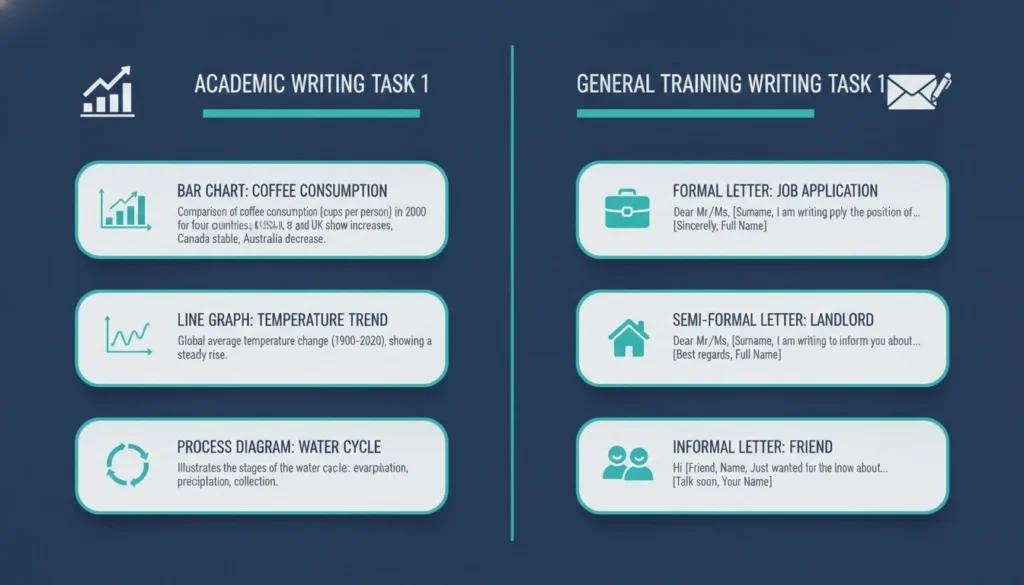
The Best Structure for Task 1
A simple four-paragraph structure works for most Task 1 answers:
| Paragraph | Purpose |
| ———– | ————– |
| Paragraph 1 | Introduction |
| Paragraph 2 | Overview |
| Paragraph 3 | Main details 1 |
| Paragraph 4 | Main details 2 |
Paragraph 1: Introduction
In the introduction, paraphrase the question. Do not copy the exact wording.
Question:
The chart shows the percentage of households with internet access in three countries from 2000 to 2020.
Introduction:
The line graph compares the proportion of households with internet access in three different countries between 2000 and 2020.
This is short, clear, and accurate.
Paragraph 2: Overview
The overview is the most important paragraph in Task 1. It gives the big picture. You should describe the main trends, highest or lowest figures, major changes, or key differences.
A good overview does not include too many numbers. It summarises the main message.
Example overview for a graph:
Overall, internet access increased in all three countries during the period. Country A remained the highest throughout, while Country C experienced the fastest growth.
Example overview for a map:
Overall, the town became more developed, with new residential areas, improved roads, and fewer green spaces.
Example overview for a process:
Overall, the process consists of several main stages, beginning with the collection of raw materials and ending with the production of the final product.
How to Describe Charts and Graphs
Charts and graphs usually show numbers. Your task is to describe the main patterns, not every single figure.
Useful verbs for upward trends:
– rise
– increase
– grow
– climb
– reach a peak
Useful verbs for downward trends:
– fall
– decrease
– decline
– drop
– reach a low point
Useful phrases for no major change:
– remain stable
– stay the same
– level off
– show little change
Example:
The figure rose sharply from 25% in 2005 to 60% in 2015, before levelling off at around 62% in 2020.
For bar charts and tables, compare categories:
The highest figure was recorded for Canada, while the lowest was seen in India.
Women spent slightly more time on reading than men, whereas men spent more time on sports.
How to Describe Maps
Maps usually show changes in a place over time. You should focus on what was added, removed, expanded, reduced, or relocated.
Useful map vocabulary:
– was built
– was replaced by
– was converted into
– was expanded
– was demolished
– was relocated
– remained unchanged
Example:
The small park in the north of the town was replaced by a shopping centre, while a new car park was built near the station.
Use location language carefully:
– in the north
– to the south of
– next to
– opposite
– between
– near
– in the centre of
How to Describe Processes
A process diagram shows how something is made, produced, recycled, or completed. Processes may be natural or man-made.
Use the passive voice when the action is more important than the person doing it.
Example:
The fruit is collected, washed, and then transported to a factory.
Useful sequence words:
– first
– next
– then
– after that
– following this
– finally
For natural processes, you may use active verbs:
The water evaporates, forms clouds, and later falls as rain.
Common Grammar Patterns
Task 1 often uses these grammar patterns:
Comparatives
Country A was higher than Country B.
The figure for 2020 was significantly greater than that for 2000.
Superlatives
The highest percentage was recorded in Australia.
The lowest figure occurred in 2010.
Passive Voice
The old factory was demolished and replaced by a hotel.
Time Expressions
between 2000 and 2020
over the 20-year period
by the end of the period
Mistakes to Avoid
Many beginners lose marks because they:
– Copy the question instead of paraphrasing it
– Forget to write an overview
– Describe every number instead of selecting key details
– Give personal opinions or explanations
– Use informal language
– Write fewer than 150 words
– Spend too much time on Task 1
– Mix past and present tenses incorrectly
– Misread dates, percentages, or units
Remember: Task 1 is a summary, not a story. You should not explain why changes happened unless the visual clearly gives that information.

Final Advice
IELTS Writing Task 1 becomes easier when you follow a reliable method. Start with a short introduction, write a strong overview, then organise the main details logically. Use accurate vocabulary for trends, comparisons, maps, and processes.
Most importantly, practise identifying the big picture quickly. A clear overview, well-selected details, and accurate grammar can make your answer much stronger, even if your vocabulary is simple. For beginners, the goal is not to sound complicated. The goal is to be clear, accurate, and organised.